
Investment · Breaking Analysis
Tesla Stock Crash 2026: 5 Critical Lessons From the Q1 Delivery Miss Every Young Investor Needs
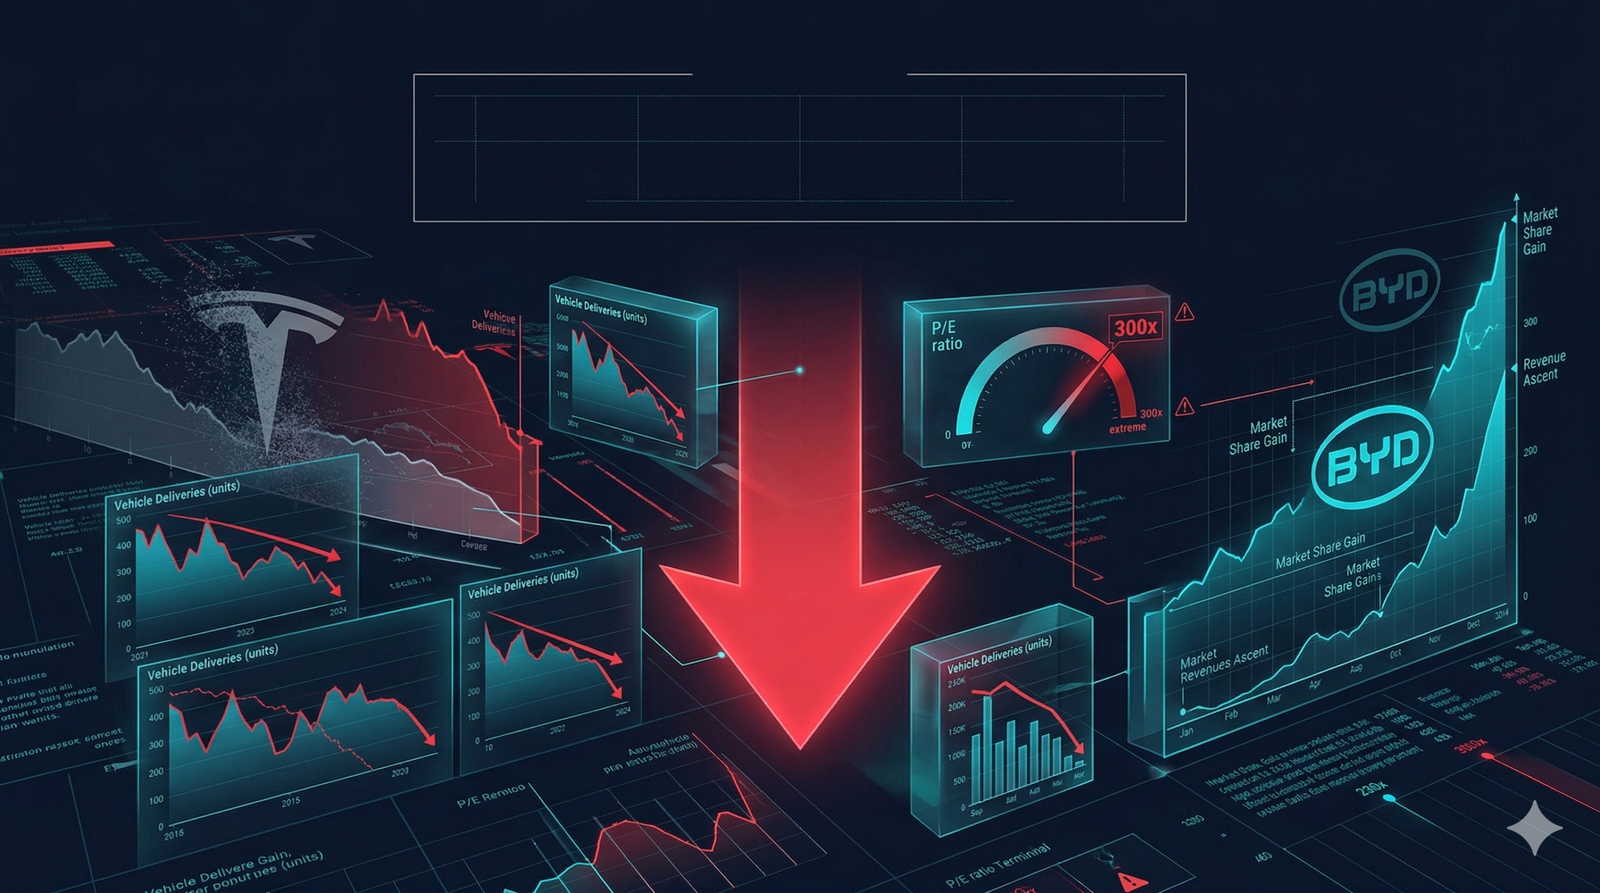
Tesla delivered 358,023 vehicles in Q1 2026 — missing Wall Street’s 365,645 consensus while producing 50,000 excess units. With a P/E ratio above 300x and BYD outselling Tesla by 600,000+ EVs in 2025, the tesla stock crash exposes critical lessons about valuation, narrative investing, and portfolio construction for a new generation of investors.
Q1 Delivery Miss
358,023 delivered vs. 365,645 consensus. Production of 408,386 units created a 50,000-vehicle inventory surplus, signaling a structural demand shortfall rather than a supply bottleneck.
Valuation Disconnect
TSLA trades at a trailing P/E of 306x while automotive peers average 7–12x. The $1.4 trillion market cap exceeds the next 20 automakers combined — pricing in a future that has yet to materialize.
Global EV Power Shift
BYD sold 2.26 million BEVs in 2025 vs. Tesla’s 1.64 million — a 600,000-unit lead. Tesla’s European registrations collapsed 39%, while BYD’s overseas sales surged 150% year-over-year.
1. What Just Happened: Tesla’s Q1 2026 Numbers Explained
On April 2, 2026, Tesla reported its first-quarter production and delivery figures — and the numbers tell a story that goes far beyond a simple “miss.” The company delivered 358,023 vehicles against a Wall Street consensus of 365,645 — a shortfall of approximately 7,600 units. On the surface, that sounds like a rounding error. Under the surface, the structural implications are far more concerning.
Let’s start with the year-over-year comparison. Q1 2026 deliveries of 358,023 represent a 6.3% increase from Q1 2025’s 336,681. That sounds like growth — and Tesla’s defenders will frame it that way. But that comparison is misleading. Q1 2025 was artificially depressed by the simultaneous global refresh of the Model Y (“Juniper”) across all four gigafactories, which caused major production downtime. Beating a historically weak quarter isn’t a recovery; it’s a low bar cleared by millimeters.
The more revealing number is the sequential decline: deliveries dropped 14.4% from Q4 2025’s 418,227 vehicles. Some seasonal dip is normal for Q1, but a 14% sequential fall is steeper than Tesla’s typical seasonal patterns. It suggests demand weakness, not just production timing.
Then there’s the inventory story. Tesla produced 408,386 vehicles in Q1 but only delivered 358,023. That’s a gap of over 50,000 units sitting on lots or in transit. When production significantly exceeds deliveries, it means one thing: the company is building cars faster than people are buying them. This is not a supply chain issue — it’s a demand signal.
The energy storage segment, often cited as Tesla’s “next growth engine,” also disappointed. Tesla deployed 8.8 GWh in Q1, down from 14.2 GWh in Q4 2025 and below the 10.4 GWh deployed in Q1 2025. Wall Street was expecting 14.4 GWh — this miss was even worse, in percentage terms, than the vehicle shortfall.
TSLA shares dropped more than 4% immediately on the news, extending the stock’s year-to-date decline to nearly 20%. For context, the S&P 500 is essentially flat over the same period. This isn’t a market-wide selloff. It’s Tesla-specific.
2. The BYD Factor: A Structural Power Shift in Global EV Markets
To fully understand the tesla stock crash in context, you need to zoom out from Fremont and look at what’s happening in Shenzhen. Because the biggest story in electric vehicles isn’t Tesla’s Q1 miss. It’s the fact that Tesla is no longer the world’s largest EV maker — and hasn’t been for over a year.
In 2025, BYD delivered 2.26 million battery electric vehicles, surging 28% year-over-year. Tesla delivered 1.64 million — down 9% from 2024. BYD outsold Tesla by more than 600,000 pure EVs. This wasn’t a quarterly blip; it was a full-year, structural overtaking. As recently as 2023, Tesla was still the undisputed global BEV leader. Two years later, it’s in a distant second place.
The competitive dynamics are even more telling. While Tesla’s lineup is essentially unchanged — the Model 3, Model Y, Cybertruck, and the now-discontinued Model S and X — BYD has flooded the market with vehicles across every segment. From the sub-$10,000 Seagull to luxury Yangwang and Denza brands, BYD covers a product spectrum that Tesla simply can’t match with two core models.
Geographically, the story is just as stark. Tesla’s European registrations fell 39% in 2025, with catastrophic declines in Germany (-48%) and France (-40%). BYD’s European sales, by contrast, surged 272% year-over-year. BYD’s total overseas sales exceeded 1 million units for the first time, up 150% from 2024.
For young investors, this is a critical lesson in competitive moat analysis. A first-mover advantage in technology does not guarantee permanent market leadership — especially when a vertically integrated competitor can undercut your pricing while matching or exceeding your scale. As CNBC reported today, Tesla’s 2025 vehicle sales slump stemmed from increased global competition and consumer backlash against CEO Elon Musk’s political activities.
3. The Valuation Trap: Understanding a 300x P/E Ratio
Here’s the number that should make every investor pause: as of late March 2026, Tesla’s trailing twelve-month price-to-earnings ratio stands at approximately 306x. To put that in perspective, Nvidia — a company at the absolute epicenter of the AI revolution — trades at roughly 47x earnings. Toyota, the world’s largest automaker by volume, trades at about 10x. The auto industry average is under 12x.
Tesla’s $1.4 trillion market capitalization means it is valued at more than the next 20 automakers combined. Yet its core automotive revenue declined in 2025, its delivery volume dropped 9%, and its global market share is shrinking. The stock’s 52-week range — from $214 to $499 — reveals extreme volatility, with the current price near $361 sitting roughly 28% below its December 2025 all-time high.
So what exactly is the market paying for? Not current earnings. Tesla’s TTM EPS is approximately $1.18, which on a pure earnings basis makes the stock extraordinarily expensive. The bull case rests entirely on future optionality: autonomous robotaxis (Cybercab), humanoid robots (Optimus), energy storage dominance, and AI leadership. These are genuine technological possibilities. But they are priced as near-certainties.
This is the anatomy of what institutional investors call a “narrative premium” — the gap between what a company earns today and what the market believes it will earn in a decade. Narrative premiums aren’t inherently bad. Amazon traded at astronomical P/E ratios for years before its earnings caught up. But they are inherently fragile. When the narrative cracks — as it did today with the delivery miss — the correction can be swift and severe.
For a deeper understanding of how valuations work in practice, check out our guide on understanding P/E ratios and stock valuation.
4. 5 Critical Lessons From the Tesla Stock Crash for Young Investors
Lesson #1: Never Confuse a Great Company With a Great Investment
Tesla is an objectively innovative company. It popularized electric vehicles, built a global Supercharger network, and pushed the entire auto industry toward electrification. But innovation alone doesn’t determine whether a stock is a good buy at a given price. At 306x earnings, even a great company can be a terrible investment if the price already assumes perfection. The lesson: valuation matters, regardless of the story.
Lesson #2: Beware the “Production vs. Delivery” Gap
When any manufacturer builds 408,000 units but only sells 358,000, that 50,000-unit surplus isn’t just a footnote — it’s a warning. Excess inventory means either demand is weakening or pricing will need to fall to move the metal. Either outcome compresses margins. Always look beyond headline delivery numbers and examine the production-to-delivery ratio for signs of demand health.
Lesson #3: First-Mover Advantage Has a Half-Life
Tesla had a decade-long head start in electric vehicles. BYD erased that lead in two years. In technology markets, first-mover advantage deteriorates faster than most investors expect. The lesson for portfolio construction: don’t assume today’s market leader will be tomorrow’s. This applies to every sector, not just automotive.
Lesson #4: Macro Environment Can Override Micro Execution
Several macro forces are working against Tesla simultaneously in 2026: the expiration of the $7,500 federal EV tax credit (ended September 2025), rising oil prices due to the Iran-Oman conflict pushing consumers toward used EVs instead of new ones, and broader geopolitical tension affecting supply chains and sentiment. Even a perfectly-run company can’t outrun macro headwinds. Always assess the macro context before overweighting any single stock.
Lesson #5: Diversification Is Not Optional — It’s Structural Defense
If Tesla represented 30% or more of your portfolio — as it does for many retail investors — today’s 4%+ drop erased significant capital. A diversified portfolio holding TSLA at a 3-5% weighting would have barely noticed. This isn’t theoretical advice; it’s the mathematical reality of risk management. The institutional standard is clear: no single position should control your financial destiny.
5. Interactive P/E Ratio & Growth Valuation Simulator
How much earnings growth does a high-P/E stock need to “grow into” its valuation? Adjust the sliders to model how many years it takes for a company’s actual earnings to justify its current stock price — the exact math institutional fund managers run before every position.
Years to Justify Current P/E
Time for EPS to “grow into” the valuation
—
Required EPS at Convergence
Earnings needed to hit target P/E
—
Implied Stock Price at Fair P/E
Current EPS × Target P/E
—
6. Your Institutional-Grade Action Plan
The tesla stock crash isn’t the end of the world — but it is a masterclass in what happens when narrative outpaces fundamentals. Here’s what smart young investors should do right now:
- 1. Audit your concentration risk. If any single stock exceeds 10% of your portfolio, that’s a structural vulnerability, not a conviction bet. Consider rebalancing toward your target allocation.
- 2. Separate the company from the stock. You can admire Tesla’s technology and still conclude that TSLA at 300x earnings is not the right entry point. These are not contradictory positions.
- 3. Use the simulator above. Model what growth rate is required to justify the current price. If it requires 30%+ annual EPS growth for a decade, ask yourself: how many companies in history have achieved that?
- 4. Understand macro headwinds. The expiration of EV tax credits, rising oil prices from the Iran conflict, and increasing global competition aren’t temporary blips — they’re structural forces that may persist for multiple quarters.
- 5. Build around a diversified core. Low-cost, broad-market index funds remain the most reliable wealth-building tool for young investors. Use satellite positions in individual stocks only after your core allocation is funded.
The greatest risk in investing isn’t buying the wrong stock. It’s letting a narrative — no matter how compelling — override the mathematics of valuation and the discipline of diversification. Today’s Tesla data is a reminder that the market, eventually, demands receipts.
For more on building a resilient investment strategy, read our guides on index fund investing for beginners and wealth management fundamentals.